The Housing Marketing in Mesquite is Hot in May of 2022
The heat is on in Mesquite, Nevada. with daily temperatures above 100 degrees! The housing market here is just as hot! Each month we do a deep dive into market statistics.
The heat is on in Mesquite, Nevada. with daily temperatures above 100 degrees! The housing market here is just as hot!
Each month we do a deep dive into market statistics. If you are even considering the sale or purchase of a home, it’s important to know the housing market so you can make informed decisions about price, availability and current market trends.
Today we are comparing the stats for the period of Jan. 1 to May 31 in 2021 and 2022. In a nutshell, fewer homes are selling in 2022 than did in 2021; however, they are selling much faster and for more money. If you’re a seller, that’s great news. If you’re a buyer, maybe not so much. If you are thinking of buying, it’s still a great time. The local price increase upward trend isn’t likely to go down (although the increased price percentage is likely to level out). If you’re waiting for prices to go down - don’t. If you wait you are likely to pay more for your home, but you could also get caught up in yet another interest hike (nobody’s rooting for that).
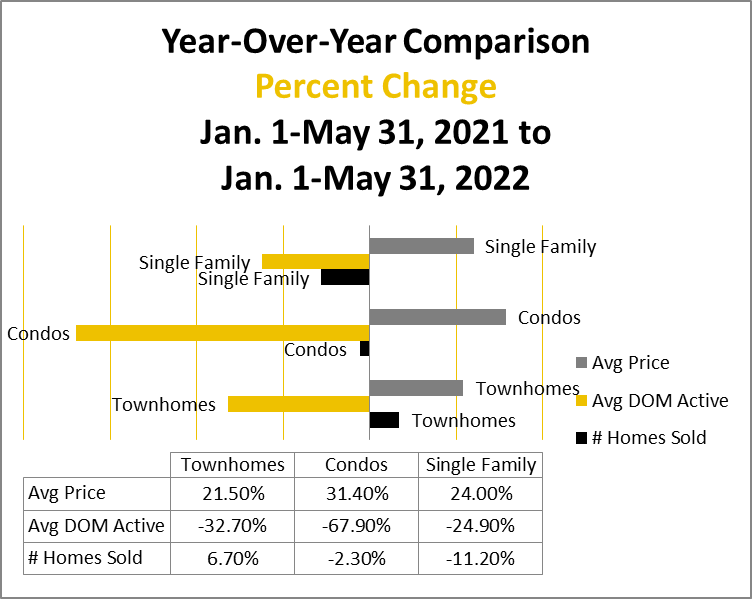
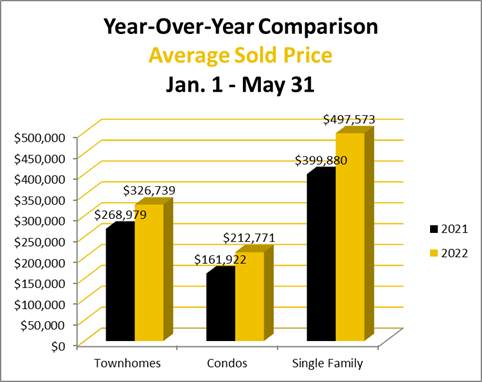
Average condo price increases 31.4 percent
If you purchased a condo during the first five months of 2021 in Mesquite, you’ll be glad to know the average price increased this year by 31.4 percent ($161,922 in 2021 compared to $212,771 in 2022).
I probably don’t need to, but I would like to remind you the average price is determined by adding all home prices together and dividing that number by the number of homes sold.
“Total Gross Sales/Number of Homes Sold = Average Sales Price”
This isn’t a perfect method for determining the price you will pay for a condo here, but it’s one of the best ways we have to measure the market. Over time the average gives us a pretty good picture of prevailing market trends.
Average townhome price up 21.5%
If you bought a townhome from January through May in Mesquite this year, you likely paid an average of 21.5 percent more than you would have paid last year ($268,979 compared to $326,739).
Average single-family home price up 24 percent
Yes, even single-family homes increased in price. In the first five months of 2021, a single-family home here would have cost you an average of $399,880. During the same period this year, buyers paid an average of $497,573.
The increase can be attributed in part to a lack of supply and an increase in demand.
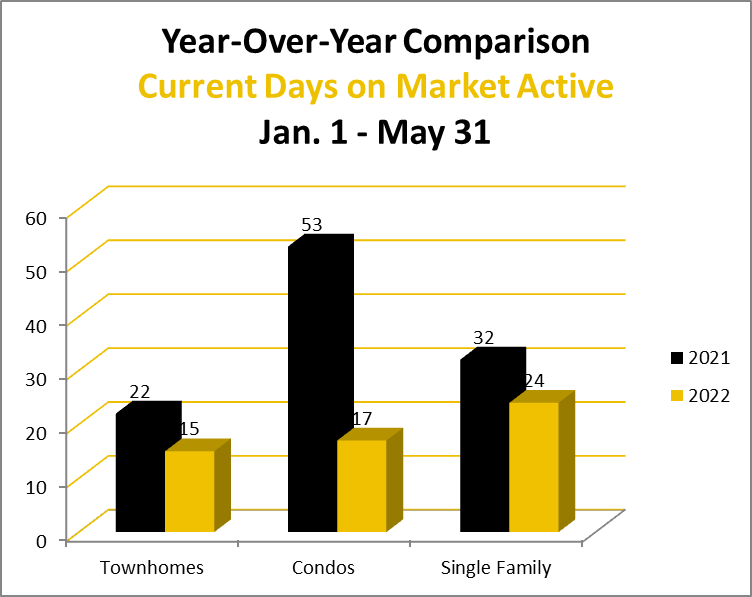
Properties are selling faster this year than last
If you want to get an idea of just how fast you might sell your home, take a look at the CDOMA (current days on market active) figures. Again, these are average numbers and there are many, many variables to consider.
In the first five months of 2021, condos were actively listed on the MLS (multiple listing service) an average of 53 days. During the same time this year, condos sold in an average of 17 days. That’s 67.9 percent faster!
In 2021 townhomes were just a little slower selling (22 days) than they were this year (15 days). Single-family homes are showing the same trend; it took an average of 32 days to sell a single-family home last year and just 24 days this year.
Fewer single-family homes and condos sold January through May this year
Last year in the first five months 88 condos were sold. This year, 86 condos were sold during the same time. I don’t put a lot of stock in that because there could have been some carry-over closings and two is not a significant number.
There was a little more discrepancy in single-family home sales year over year with 303 sold in 2021 and just 269 sold during the same period this year.
Townhome sales actually eeked up a little this year with 75 sold last year compared to 80 sold this year.
It could be some people who prefer single-family homes are buying townhomes instead due to the increased cost of housing.
If you have a home to sell, or if you are ready to buy in this still-very-reasonably-priced resort community, please call me today. I would love to answer all your questions.
Homes for sale in Mesquite, Nevada
Thinking about a move to Mesquite?
Browse every active listing — Sun City 55+, golf-course homes, new construction and more — updated multiple times a day. Or talk to a local agent who knows the neighborhoods.
Keep reading
More from the blog
Which Electric Chainsaw Works Best for Small Property Jobs?

Relocating to Utah: Setting Up Your Digital Life in a New State

How Jamali Garden Helps Homeowners Create Curb Appeal